Skip to content
ABOUT
RESUME
PUBLICATIONS
PUBLIC SPEAKING
CONTACT
ABOUT
RESUME
PUBLICATIONS
PUBLIC SPEAKING
CONTACT
The Future of Law and Technology
Meet Ryan
Watch Video
Find Out More
Resume
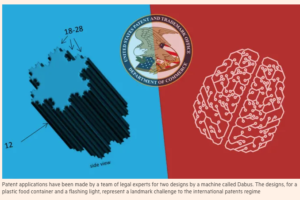
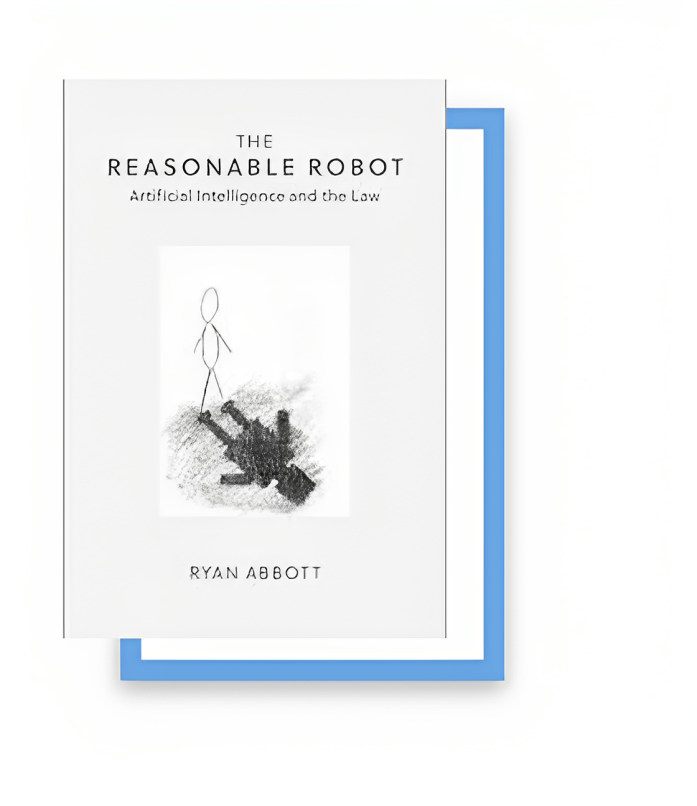
The Artificial Inventor Project
Media
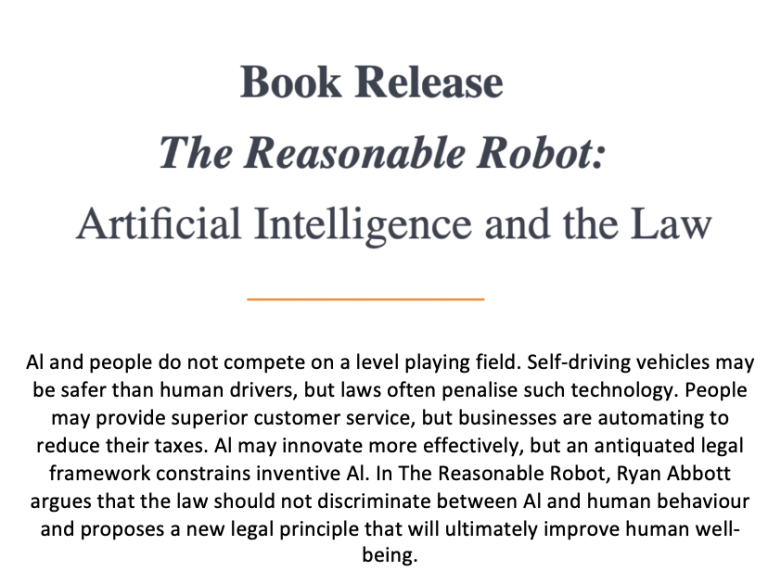
Get it Now
Get it in Chinese
Audiobook
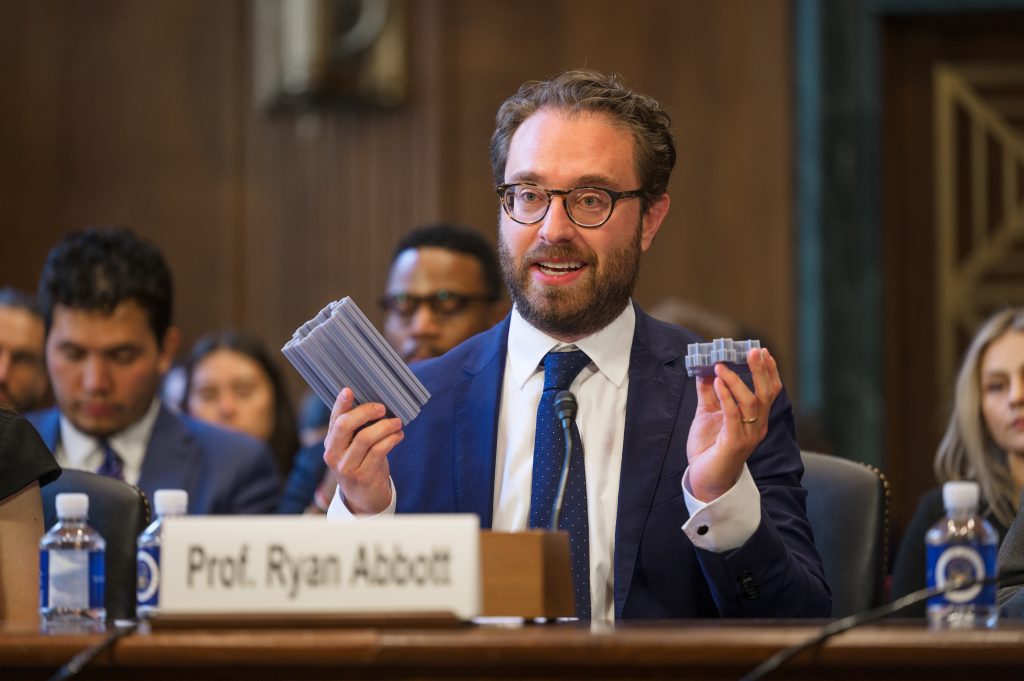
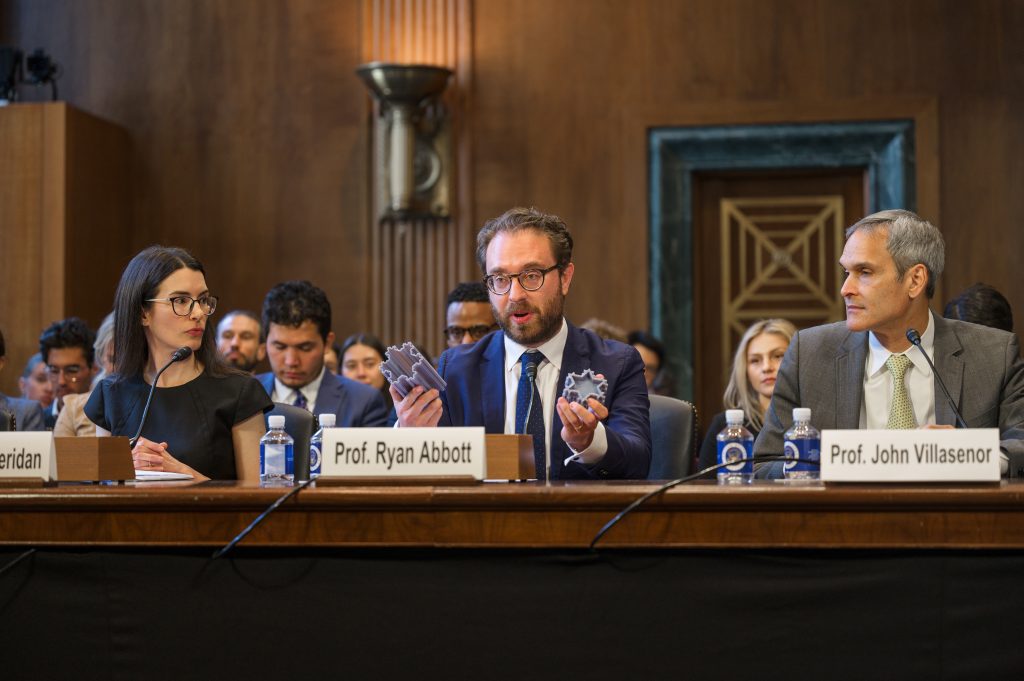
Prof. Ryan Abbott shares his views on AI and patent law with the US Senate Judiciary Subcommittee on Intellectual Property
Other Projects and Videos